Nearly everything can be reduced to a pattern. In science, researchers aim to find models that fit phenomena in the universe. In history, they develop “frames” to help describe complicated events. A war, for example, could be studied in terms of its causes, the disagreement between the sides, or perhaps from the lens of human suffering. It could also be shown in a positive light, or a heroic battle against evil, as WWII is often expressed.
My point is that if something can be reduced to a pattern or a frame like this, it can usually be expressed with a graphic organizer, a matching activity, or a sorting activity. I am baffled by the fact that these activities are not used more often among content teachers, as they are perfect for simplifying concepts for MLL students and giving them an opportunity to demonstrate their knowledge without, say, writing an essay or requiring much advanced language.
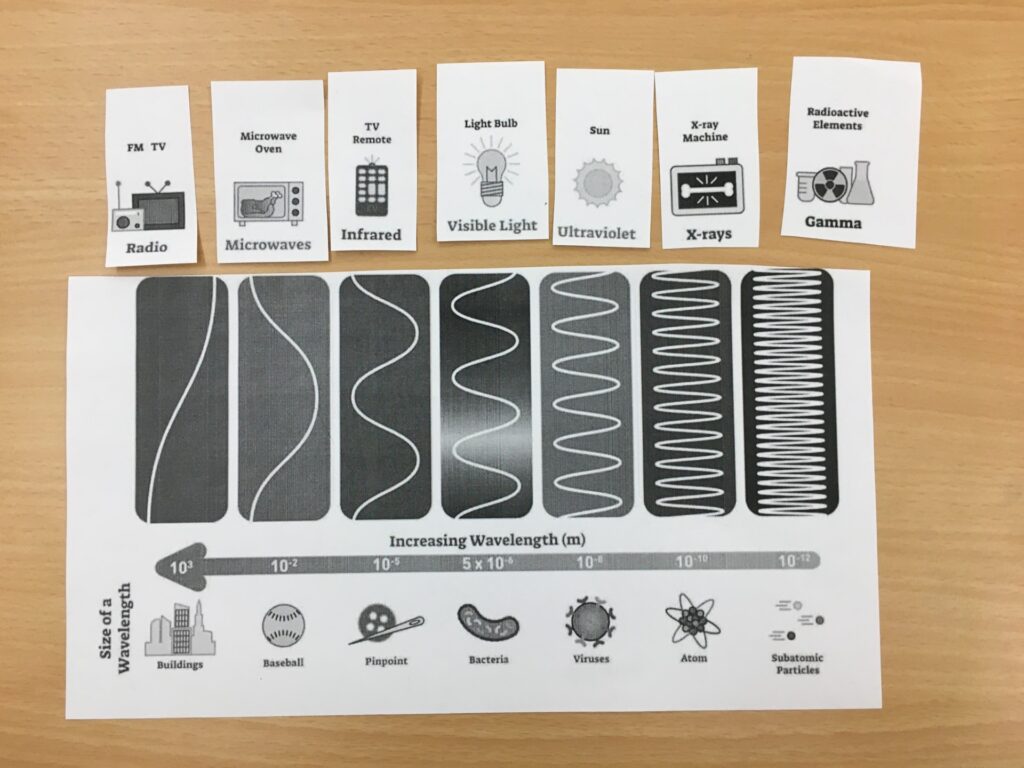
Recently I helped students with a science lesson about the electromagnetic spectrum. It’s just a set of waves, really. These waves are categorized into 7 types. One type is light, another is radio waves, another is X-ways, and so on. They are put in a sequence according to their wavelength. This could be a perfect card sorting activity: sort the save types in order based on their wavelength.
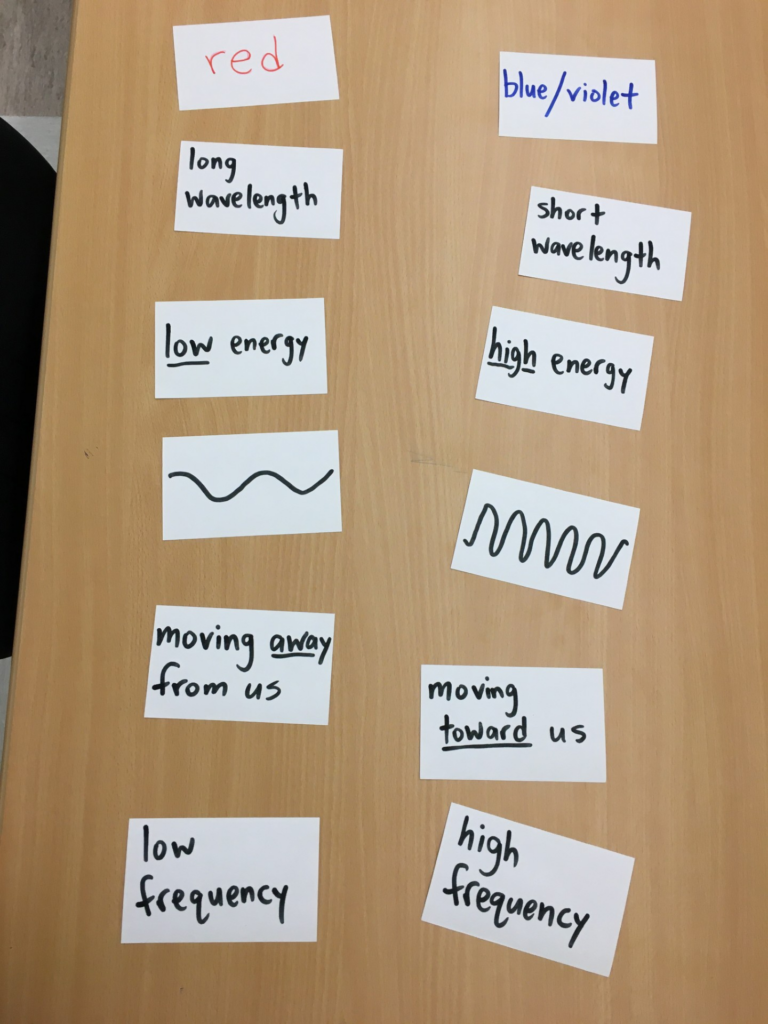
Another concept in the unit was redshift, one type of evidence for the Big Bang theory. Basically, as objects move away, their waves (sound or light) become stretched out. If they are sound waves, this means they have lower pitch (as a train moves away its horn sounds lower – the Doppler effect). If the waves are light, they shift toward the red end of the spectrum. So in “redshift”, scientists noticed galaxies are shifting toward red, which means they’re moving away from us, which means the universe is continuing to expand. And that’s evidence for the Big Bang.
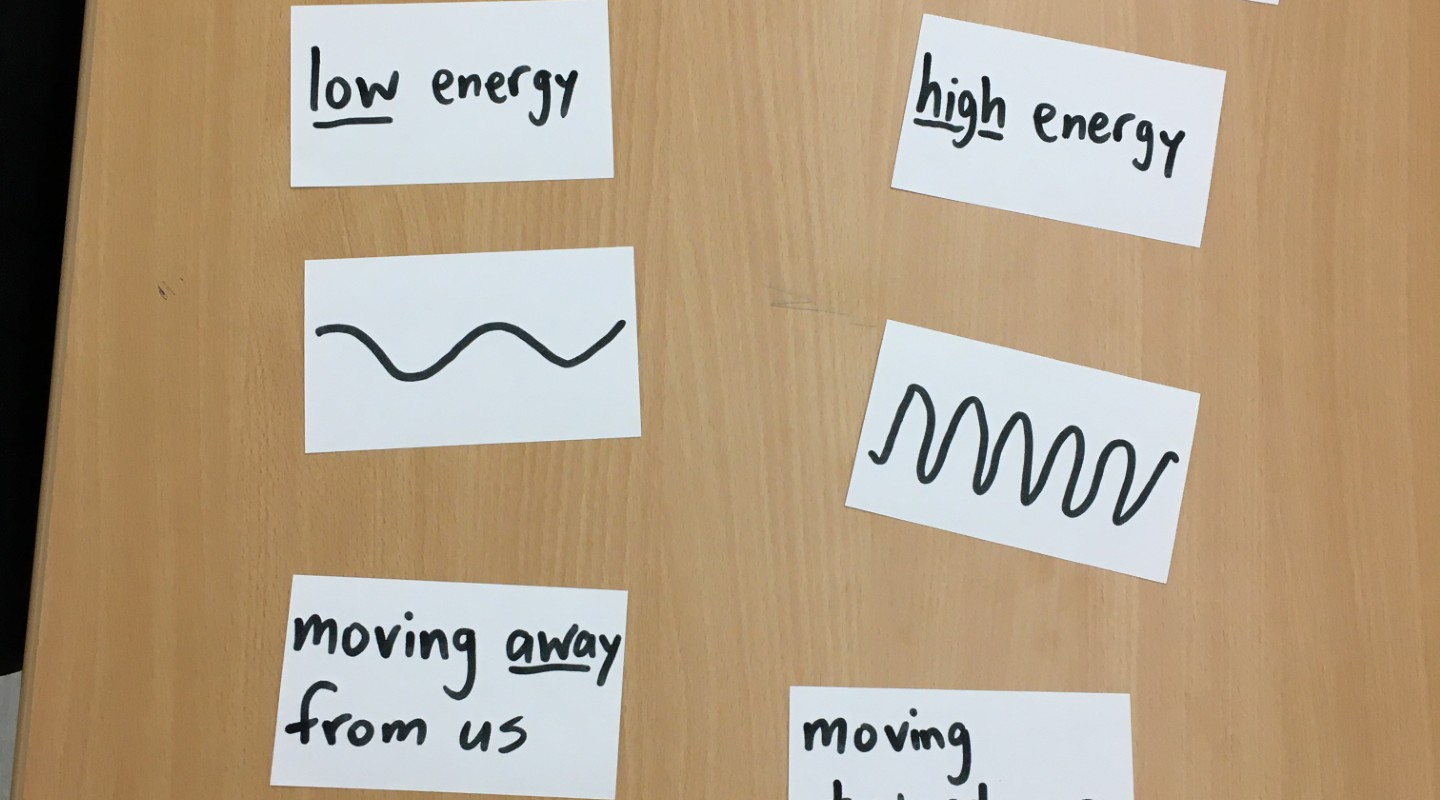
Anyway, in this science unit there were so many terms being thrown around without any “frame” or “model” or organizational pattern that students were getting confused. Imagine this list of words: high frequency, greater distance, redshift, blue, moving towards us, moving away from us, longer wavelength, higher energy. It seems confusing!
But if we can recognize the pattern and make categories or a sort of some kind, like below, it gets much simpler. Of course charts are helpful and teachers use them often. But the best thing about a chart is that if you can put things in a chart, you can usually make a flashcard sort activity out of it.
Here are some things you can do with information that’s been put into a chart, diagram, or model:
- Sort steps in a process
- Sort things from largest to smallest, fastest to slowest, etc.
- Sort things into a number of categories based on their characteristics
- Sort things based on whether they’re good or bad
- Sort the names of historical figures based on whether they would agree or disagree with a statement
Science, especially, is a content area where these kinds of patterns are everywhere. The nitrogen cycle. The differences between ecosystems. The food chain. The steps in the cell reproduction cycle. And so on.
With the new NGSS standards pushing critical thinking, and the whole claim-evidence-reasoning framework that’s so popular now, I fear that teachers are focusing too much on lengthy explanations and getting students to explain things before they even fully grasp the basic concepts. This is even more true with MLL students. Through a sort activity, the teacher can instead ask students to orally explain why they sorting things as they did. This would be the “reasoning” of CER and would involve critical thinking.